Metrics
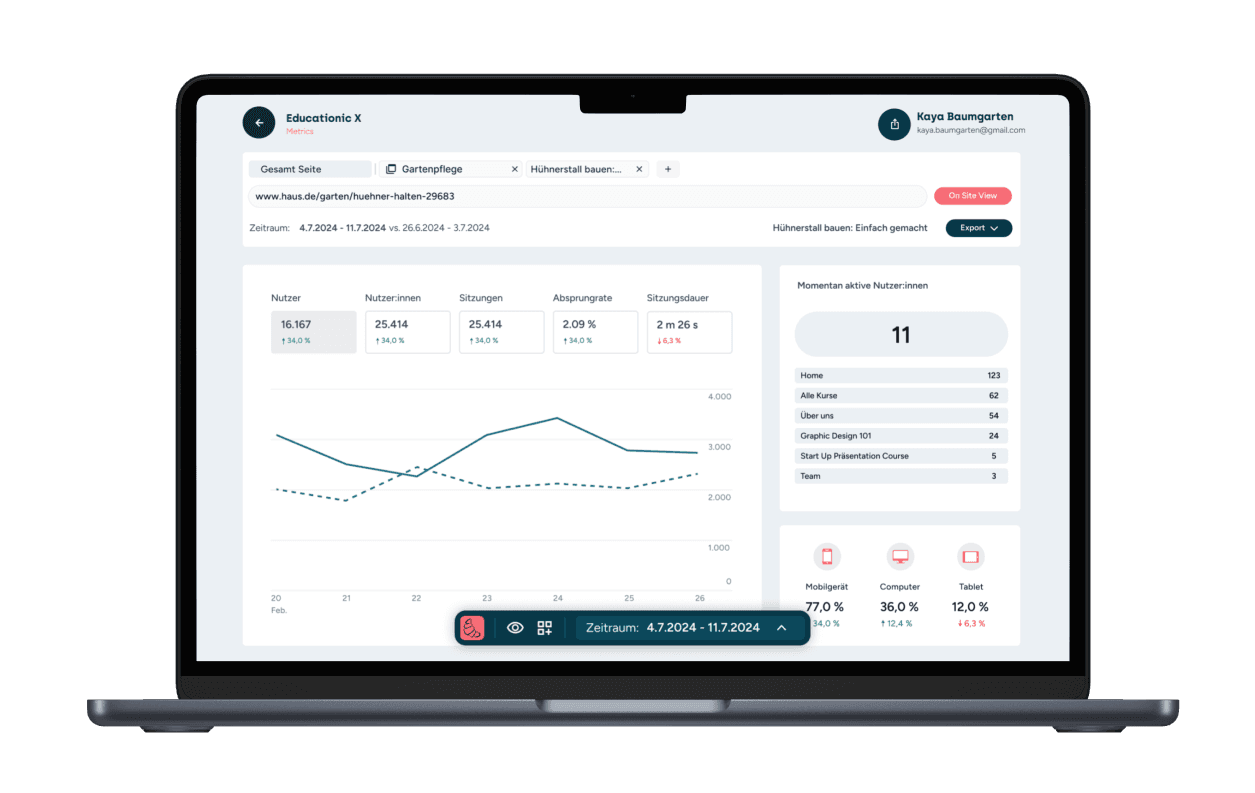
With the 'Metrics' module, you get a straightforward overview of your website's performance and individual web pages.
On-site
In the 'Onsite' module, you can configure your interface on demand by toggling different views and also check out and analyze the performance of individual website elements through a click heatmap.
User Journeys
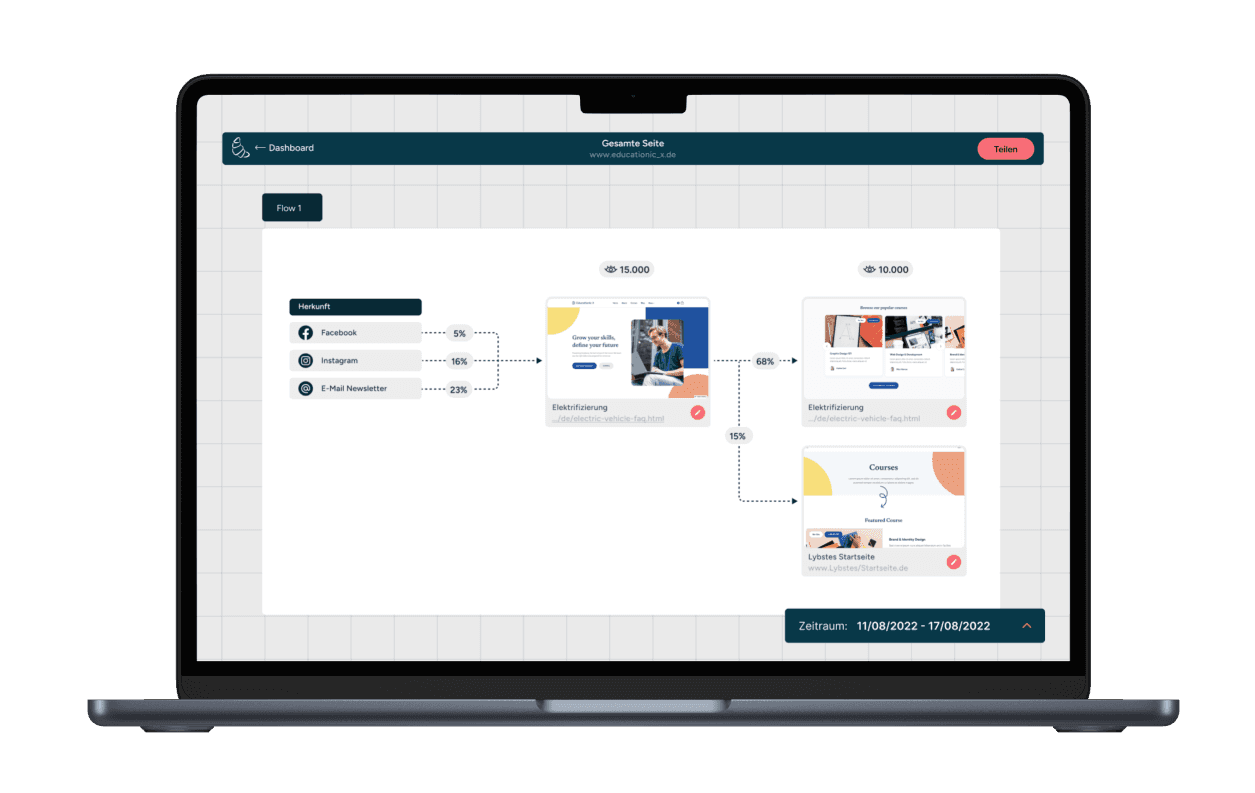
sitebrunch shows you the top 3 user flows on your website.
Live Click Heatmaps
Live click heatmaps give you a visual representation of user activity on your website. Get insights into the most-clicked areas and understand how your visitors navigate.
Comments & Tasks
With sitebrunch, you can easily comment on elements directly on your website using a simple browser extension and notify your team members.
Campaign
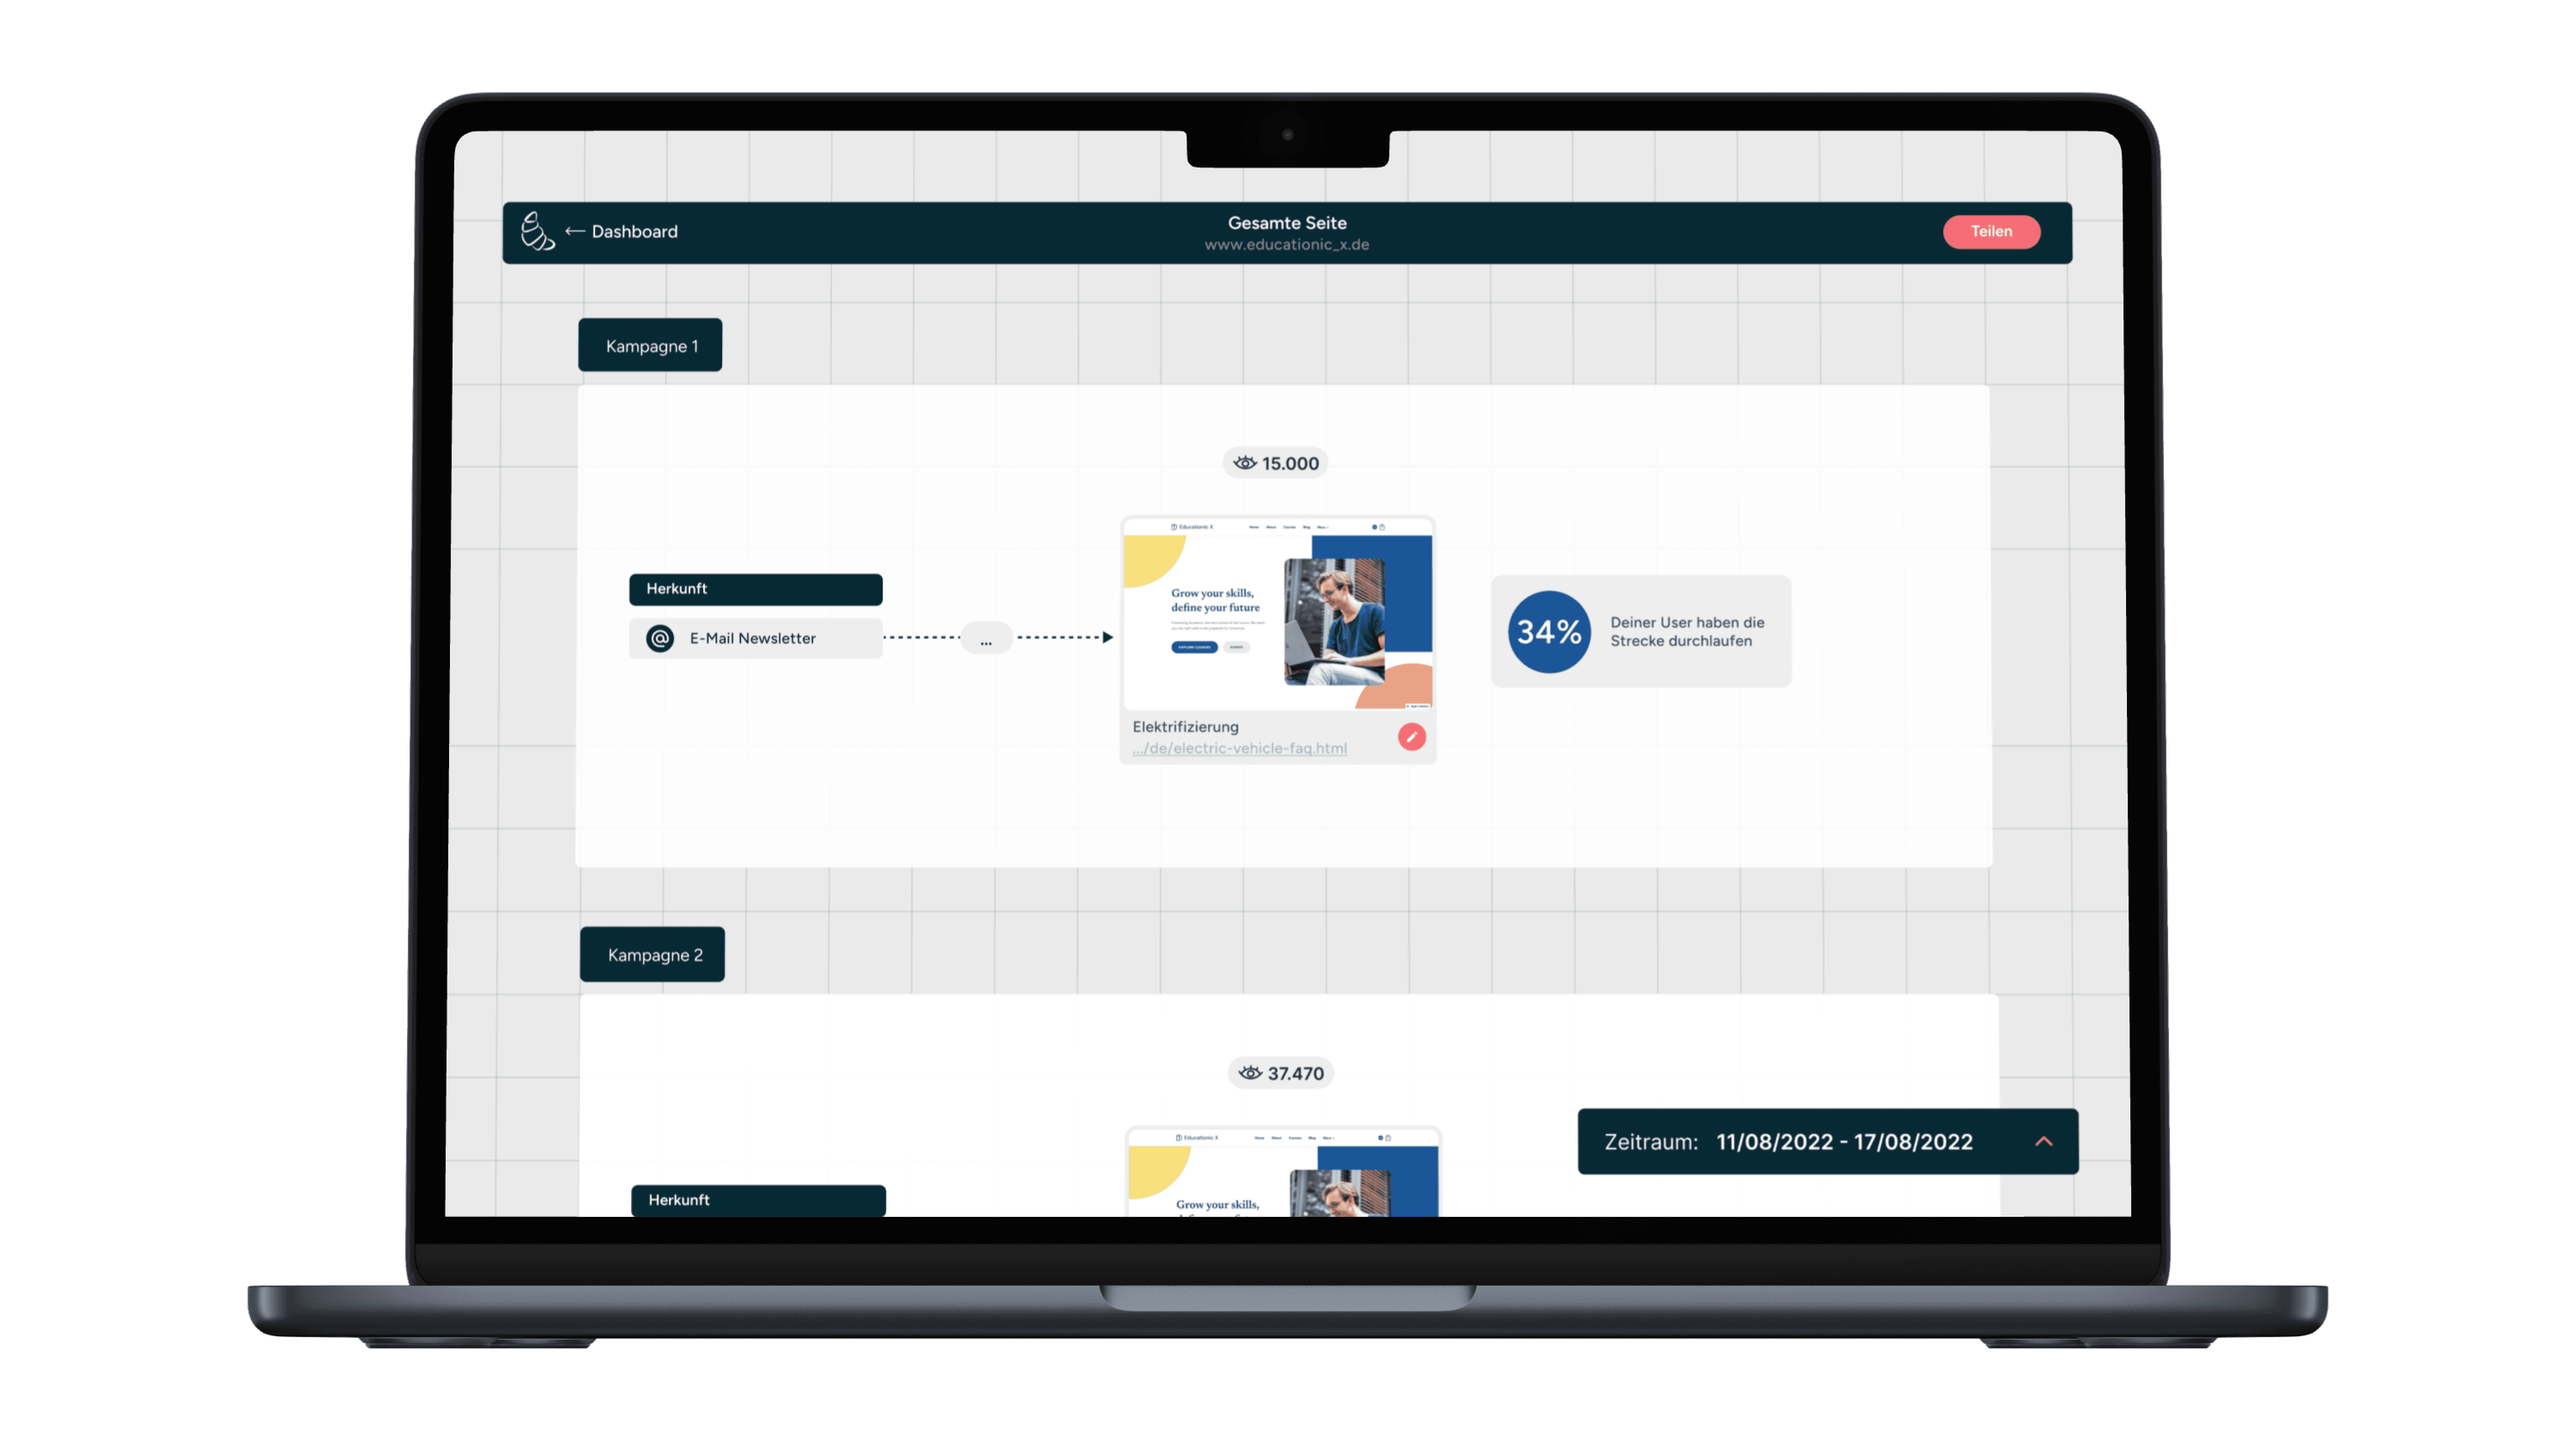
Your visual helper to check out the success of your UTM campaigns.
Accessibility Check
Unser automatisierter Accessibility-Check hilft dir, die ersten Barrieren auf deiner Website zu identifizieren und zu verbessern.
Export
The easy and intuitive export option to .csv and .pptx makes data super accessible. Once exported, you can customize and edit the data, then share it with management in all the usual formats.


